 Discovered by serendipity, the Post-it note is a staple today in offices, industries, and retail stores. According to my source, it’s one of the top five office supply items of all. FedEx leaves Post-it Notes on the door when no one is at home to receive a package. The post office uses Post-its for forwarded mail. That label across the bottom of the envelope, which sticks completely and for the full length of the paper—but can be peeled off completely as well—represents an advancement in Post-it Note technology, showing us that good ideas just get better.
Post-its are ubiquitous in classrooms, too. Every teacher I know uses them. I use them—and teach kids to use them—to
- Substitute as a place to write margin notes in their rented textbooks
- Write summaries (the size of the Post-It determines the length of the summary)
- Jot down ideas or questions for discussion
- Create temporary labels for piles of materials
- Mark significant passages or reading progress
There are even Post-its the size of posters. Teachers without whiteboards write daily objectives on these giant Post-its, swapping them out from day to day. Groups jot their notes or their conclusions on these temporary posters and hang them on the walls to serve as speaking notes. They can leave the notes up afterward for the whole class to review.
A couple of years ago, in my capacity as an instructional coach for teachers in my district, I hit upon another use for Post-its, one that involves measuring shifts in attitude. I wanted to know, originally, where the secondary teachers I was working with stood vis-à-vis implementation of the Common Core, and then, after I had finished with my professional development presentations on the subject, whether what I’d said and had the teachers do had had an impact. I wanted to know if what I was doing was changing attitudes.
How do you measure an attitude shift?
Furthermore, I wanted to share that information with the teachers.
Instantly.
How could I do that?
Somehow, I hit upon the idea, at the start of my Common Care presentations, of giving everyone in attendance a Post-it note (all the same color) and asking them to array their notes along a spectrum from left to right. I drew a line across the whiteboard at the front of the room and at strategic points along the line, I wrote the following summations of opinion:
- Far Left: This is just one. more. thing. It’s all going to go away, so why should I change?
- Left: You’re kidding? Really? Okay, but where do I start? I’ve got a lot to learn.
- Center: I’m on the fence.
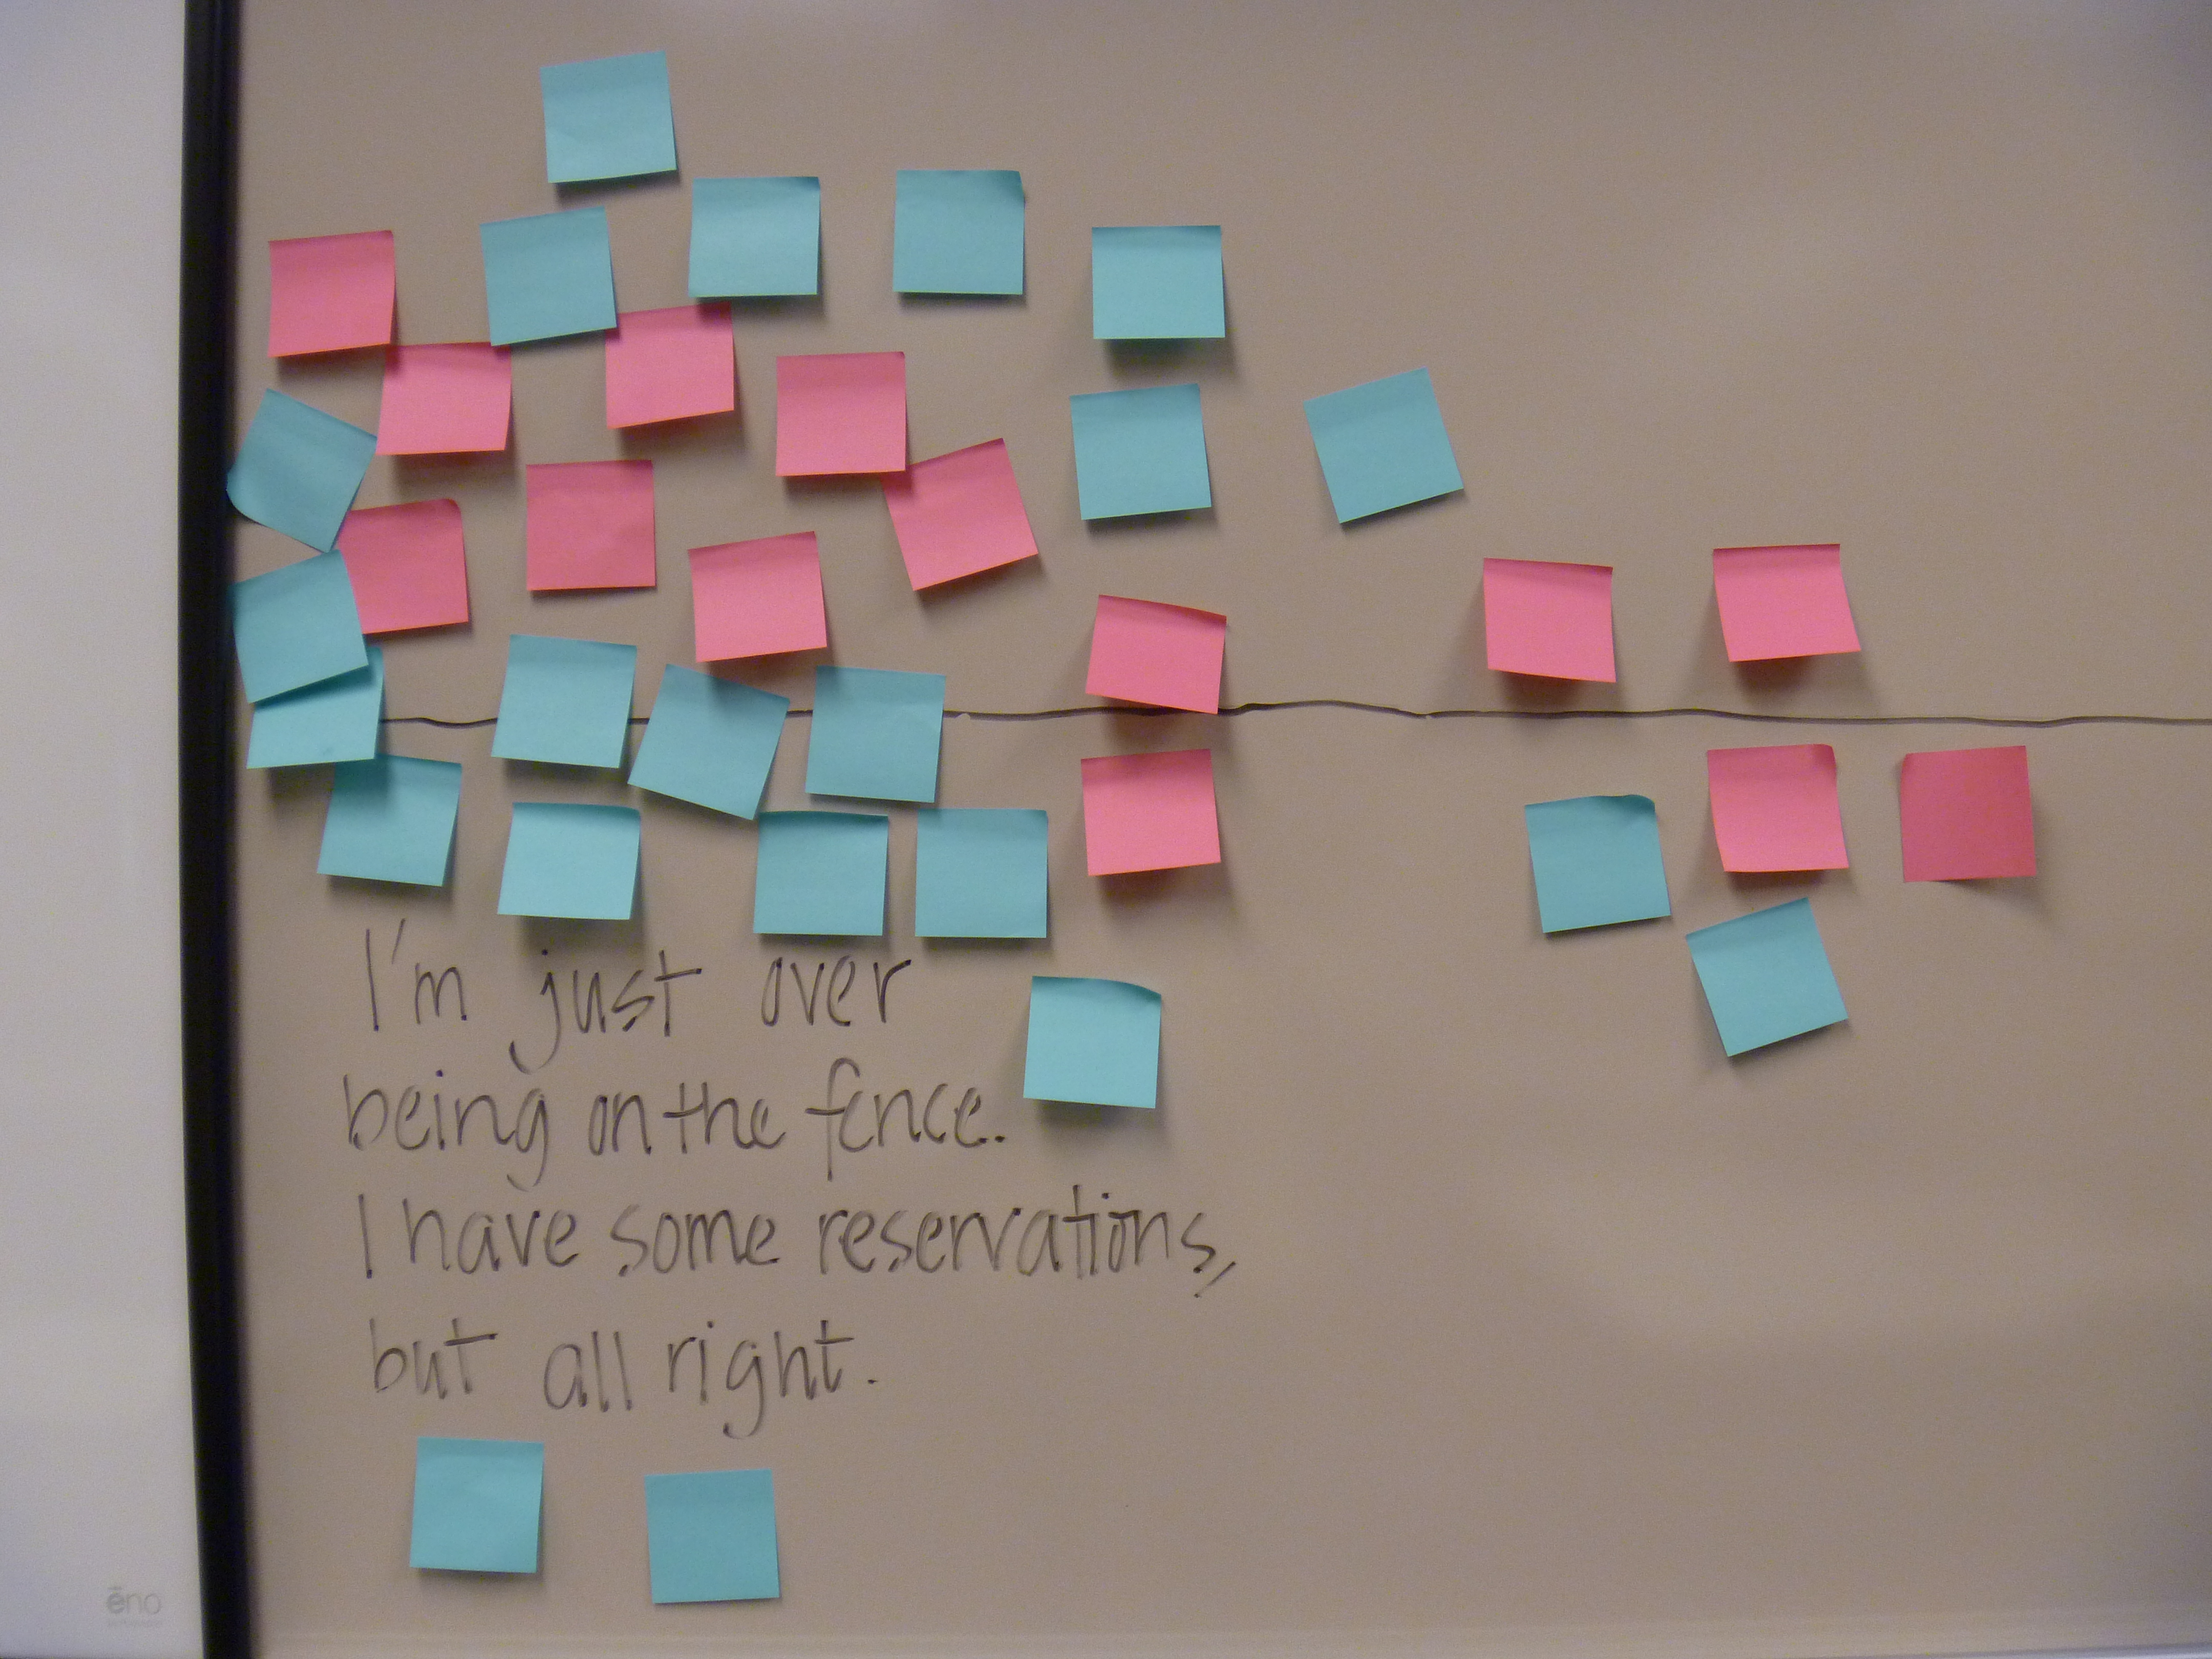
- Right: I’m just over being on the fence. I have some reservations, but all right.
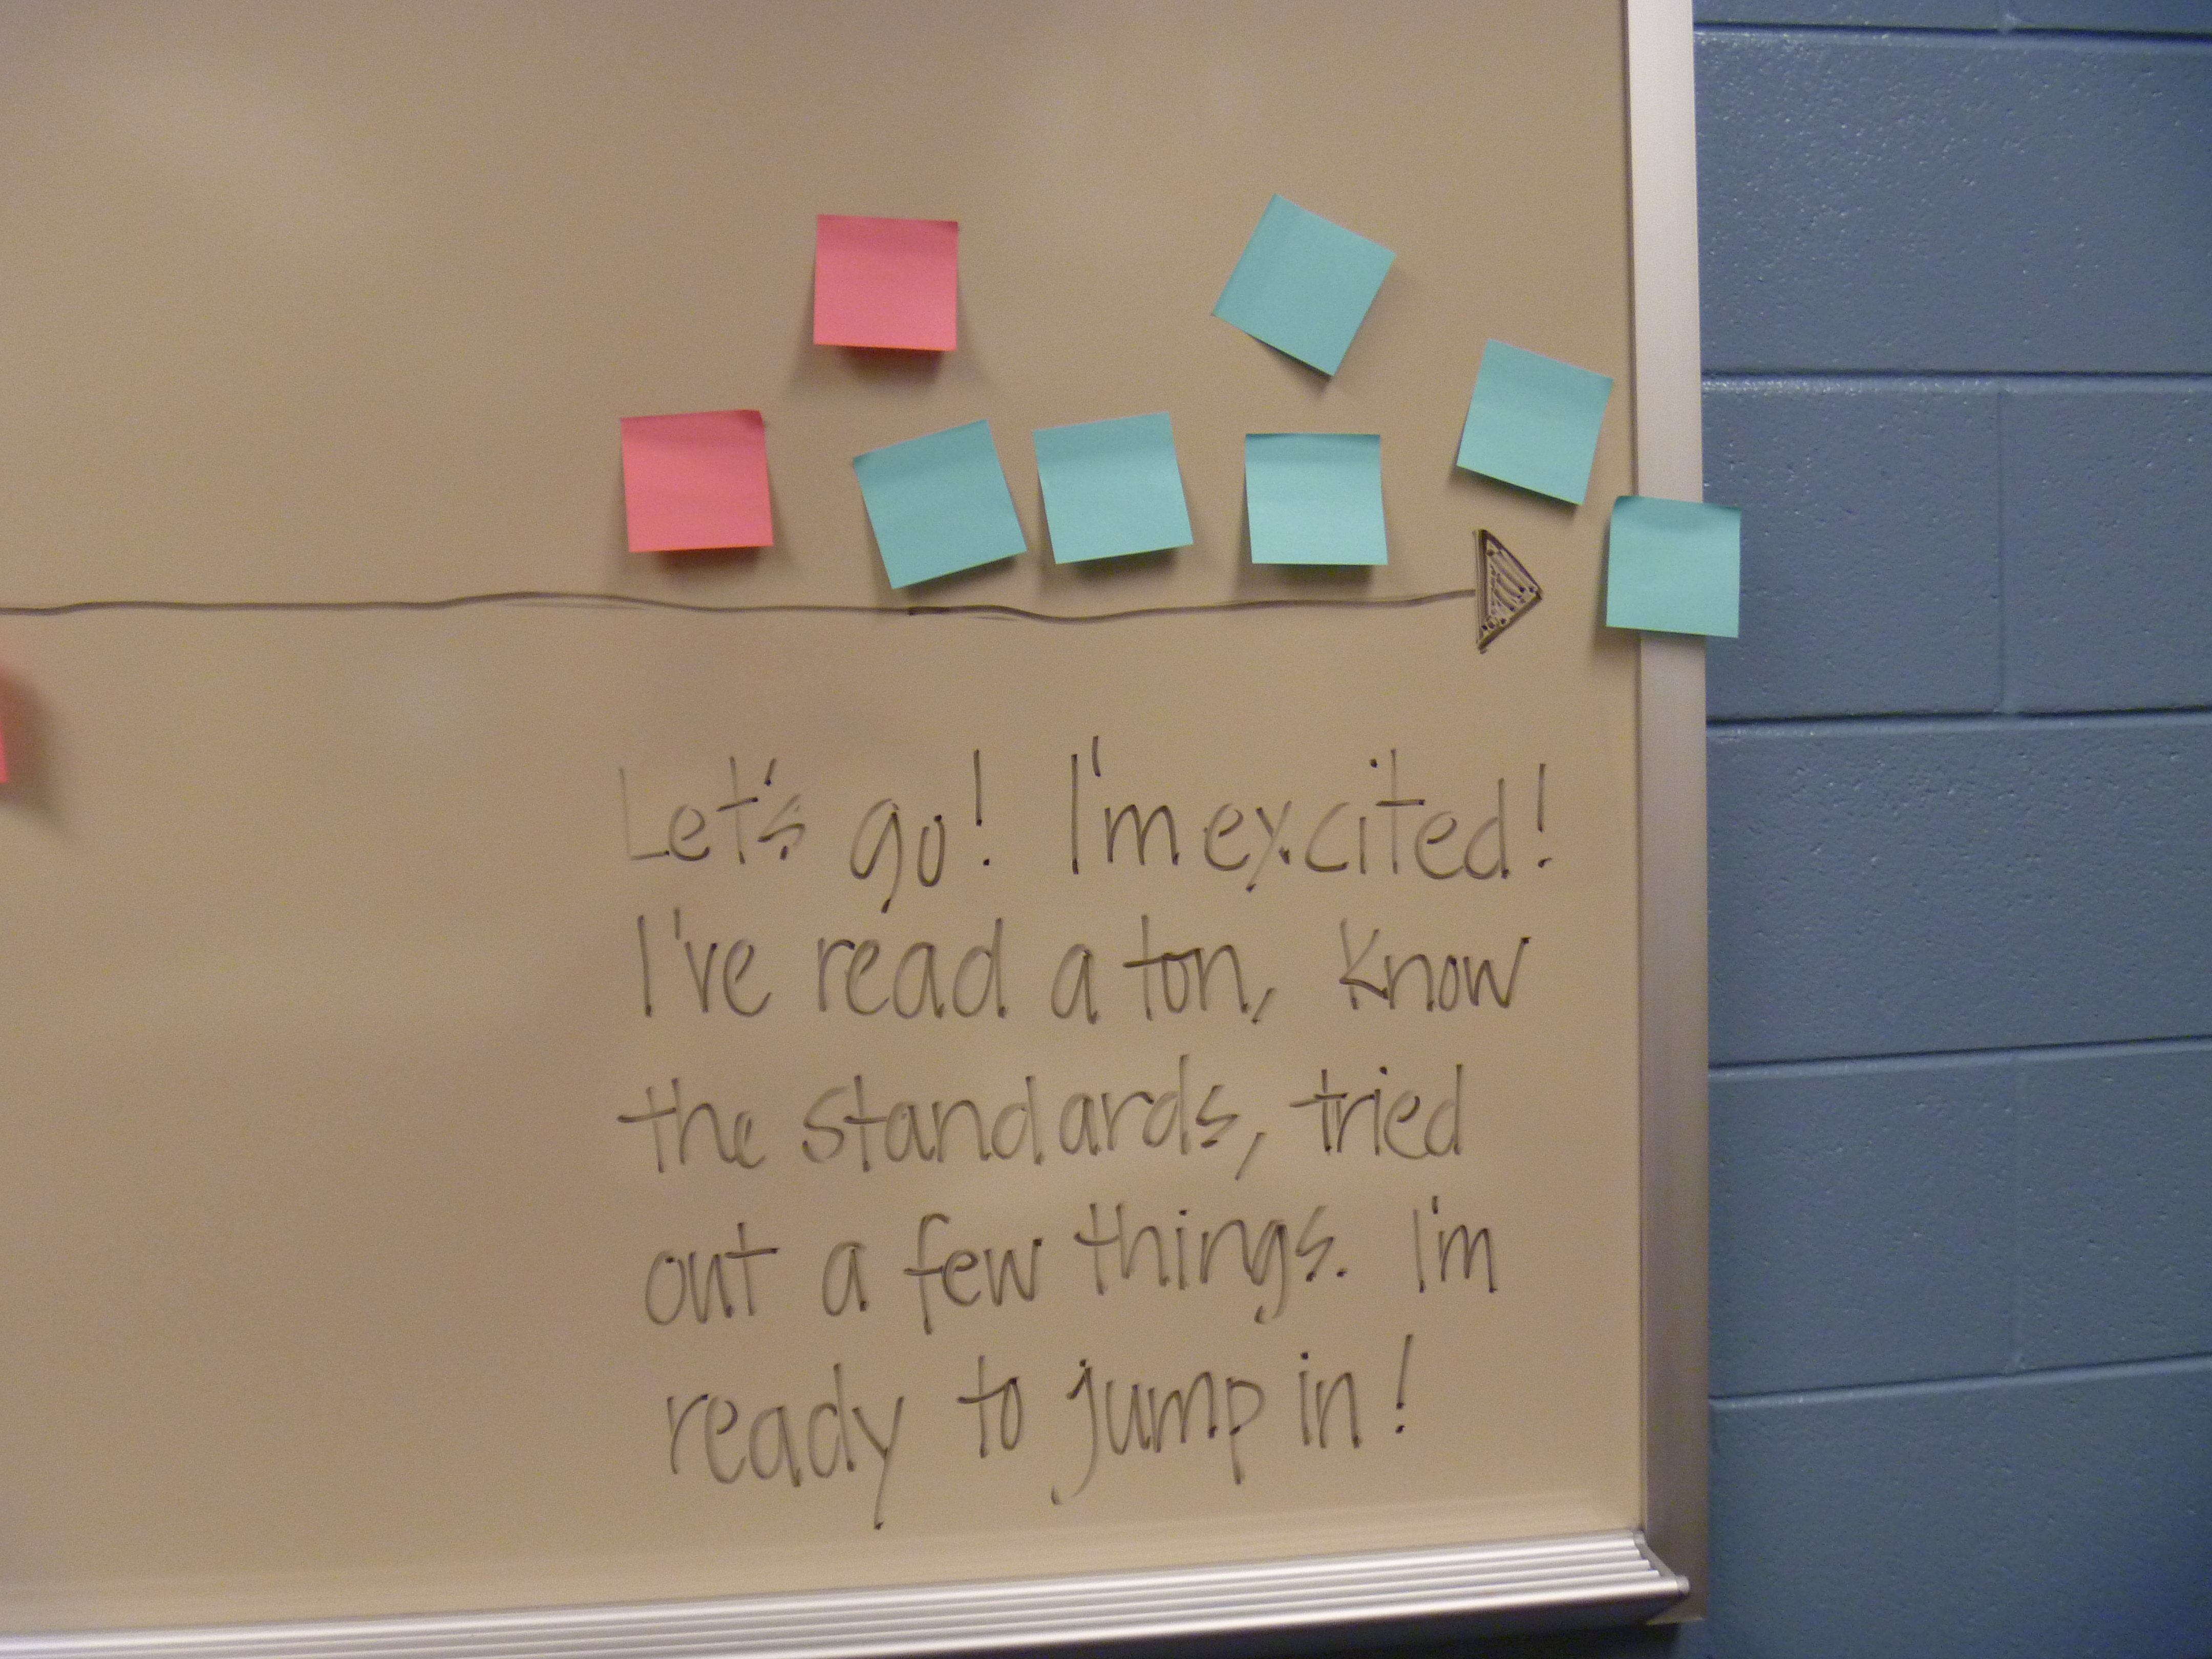
- Far Right: Let’s go! I’m excited! I’ve read a ton, know the standards, tried out a few things. I’m ready to jump in!
The teachers had no idea that I planned to ask the same question again at the end of my sessions. They assumed my visual survey was just a way to assess prior knowledge (which it was) and take a reading on staff opinion (which it also was). They did not write their names on the Post-its and I didn’t watch while they affixed theirs to the wall.
When the workshop was finished, several hours later, I gave everyone another Post-it—this time in a different color—and asked them to do the same thing: Place their Post-it on the wall somewhere along the same spectrum. I deliberately turned my back so I couldn’t see who put theirs where.
 Here’s what the Post-its revealed. (Pink is “before”; blue is “after.”) Of course, the response wasn’t universally enthusiastic—I didn’t expect that—but I was gratified to see that the overall shift was from left to right, proving, above all, that understanding something goes a long way towards supporting it. Or put another way: Education matters.
 Since then, I’ve shown teachers who are trying to measure an attitude shift in their classes this same (quick and non-scientific) strategy, and it has worked for them, too.
For example, here’s one from a business teacher who wanted to know if her financial literacy course had made an impact on her students’ spending habits. She extended the concept to measure the shift in two classes simultaneously.
At the start of the term, the five points on her line were these:
- Far left: Spend every cent I can get my hands on—and more.
- Left: Hmmm. Maybe I should save some.
- Center: Save half (if I can). Spend half.
- Right: Budget for expenses. Save all I can.
- Far Right: Invest so my money can make money.
 In this picture, you see the results from two classes: one pink, the other yellow. The spread on the bottom is the beginning of the semester; the one on top, the end. Notice the movement to the right in both classes–although the two yellow Post-its on the left represent the same two students, before and after. (Ah, well. Some people never learn.)
Because these Post-its would be up on the wall for the whole semester, we both assumed students would forget where they’d placed theirs. So the teacher had her students write their names on the backs of those little pieces of paper. That way, by turning them over at the end and finding their names, the students could see how far they’d come individually. 
This year, another colleague, a high school Spanish teacher, is going to use the strategy to measure the development of her students’ comfort level with speaking Spanish. The purpose of learning a language is to be able to communicate in that language, but developing speaking skills is usually a challenge—for both the teacher and the students. Adults (and I’m counting high school students as grown-ups here) often feel inadequate when they open their mouths to speak in a foreign language. They know the words they use are basic, and the grammatical mistakes they make are embarrassing—because they wouldn’t make those same mistakes in their native language. So my colleague and I brainstormed a long list of opportunities, first just to hear spoken Spanish outside the classroom and then to interact with fluent Spanish speakers—a list of possibilities that grows progressively more interactive and engaging as the year goes along. Of course, the activities are a requirement of the course because her hope is that through authentic speaking experiences, students will become more comfortable—and ultimately more fluent.
To measure the students’ growth, here is the continuum my colleague will use:
- Far left: Silencio! I’m scared to open my mouth!
- Left: I’ll speak if I have to, but I don’t like it.
- Center: Comfortable—as long as it’s memorized conversation!
- Right: It makes me nervous, but it’s fun at the same time!
- Far right: I love it. I enjoy speaking Spanish!
She plans to have the students chart their progress three times during the year: in August, in January, and in May. That means three colors of Post-it Notes.
Except that a good idea just got better! Fearful that after a whole year the Post-its will lose their sticky and flutter to the floor, my colleague is going to write the attitude points on pieces of construction paper, laminate the paper, and have the students use large Avery dots (in three colors) to mark their progress.
And now I am curious: How could you use this visual survey strategy? What attitude shift would you like to measure?
Link: www.todayIfoundout.com/index.php/2011/11/post-it-notes-were-invented-by-accident/

I am brainstorming what question I want to use in my Junior High Sunday school class.
LikeLiked by 1 person